
LLM cost per task: when cheap tokens cost more

The saving looks obvious. One model charges half as much per token as another. Same task, lower rate, smaller bill.
A rare spreadsheet that appears to be on your side.
Then the cheaper model uses more tokens.
Perhaps it thinks for longer, writes a longer answer, or needs another attempt. The rate really is lower. The total can still be higher. Nobody has moved a decimal point; we were comparing the price of the ingredients before seeing the recipe.
LLM cost per task is the cost of doing a defined piece of work. It depends on token prices, how much the model consumes, and the system around it. The cheapest tokens and the cheapest completed task are different contests.
We can see that difference in our own measurements. But before looking at the chart, one detail matters: what exactly are we holding constant?
The model does not work alone
In an agent, the model sits inside a harness: software that manages instructions, context, tools and the steps needed to finish. One harness may send more context, call the model more often or check its answer differently from another. That can change both the result and the bill.
Arena’s HarnessTax research compared 21 model–harness combinations on samples from two coding benchmarks. The same model could have similar success rates at substantially different costs. Those findings are limited to the tested workloads, but they make the surrounding software hard to ignore.
To compare models fairly, the harness, task and available tools need to stay consistent. To compare harnesses, the model needs to stay consistent. Changing both can reveal a useful system, but it cannot tell us which change caused the saving.
This article focuses on models in a shared test setup. Harness efficiency deserves a separate article, which we plan to cover later. Even when the setup stays the same, models can consume quite different amounts of tokens.
Token price is only half the calculation
A token is a piece of text. Models have rates for reading input and generating output. At ordinary uncached rates, the basic calculation is:
Request cost = input tokens × input rate + output tokens × output rate
Rates quoted per million tokens need the corresponding division by a million. Cache discounts, long-context tiers, tool charges and other applicable pricing rules can change an actual bill.
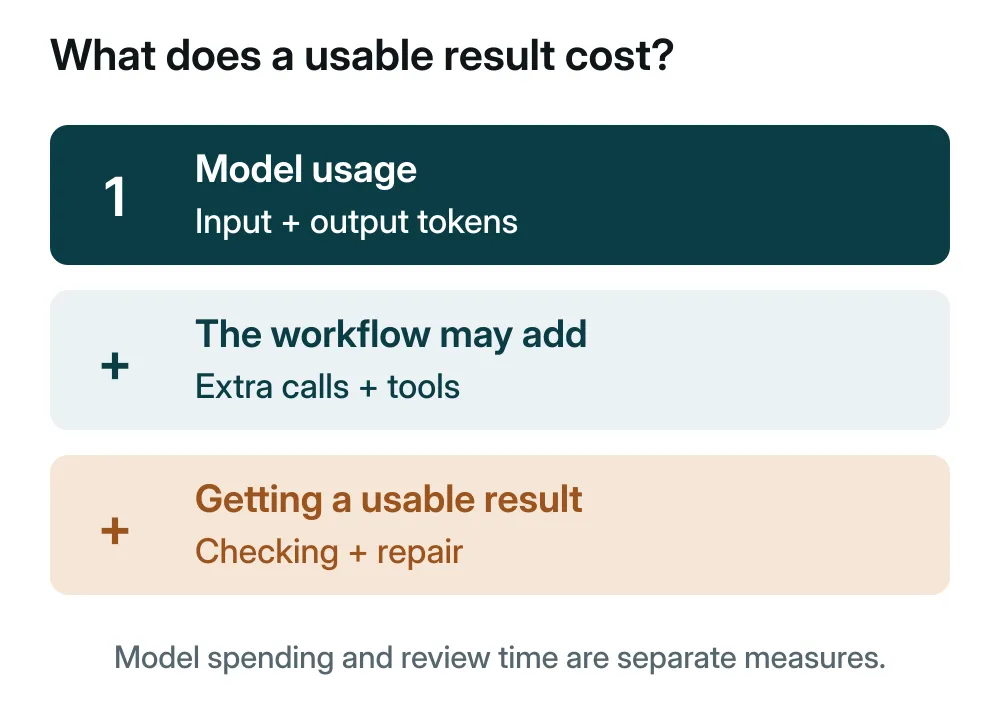
The rates are only half the calculation. The quantities matter too. The same prompt can lead to a short answer from one model and a longer answer with much more reasoning from another. Models can also tokenize the same text differently.
That makes a fixed writing task useful: it lets us observe consumption rather than assume it.
When cheaper tokens produce a bigger bill
MindsHub provides access to multiple models through MindsHub Inference, our API. We run our own response-time and token-use tests through that service. The cost figures below come from those measurements, independently of Artificial Analysis or another company’s cost leaderboard.
Our cost test is deliberately simple: the same fictional market-hall brief asks each model for a visitor’s guide of at least 800 words, with shared content and formatting requirements. It is one writing task repeated at available reasoning settings, not a broad evaluation of every kind of work.
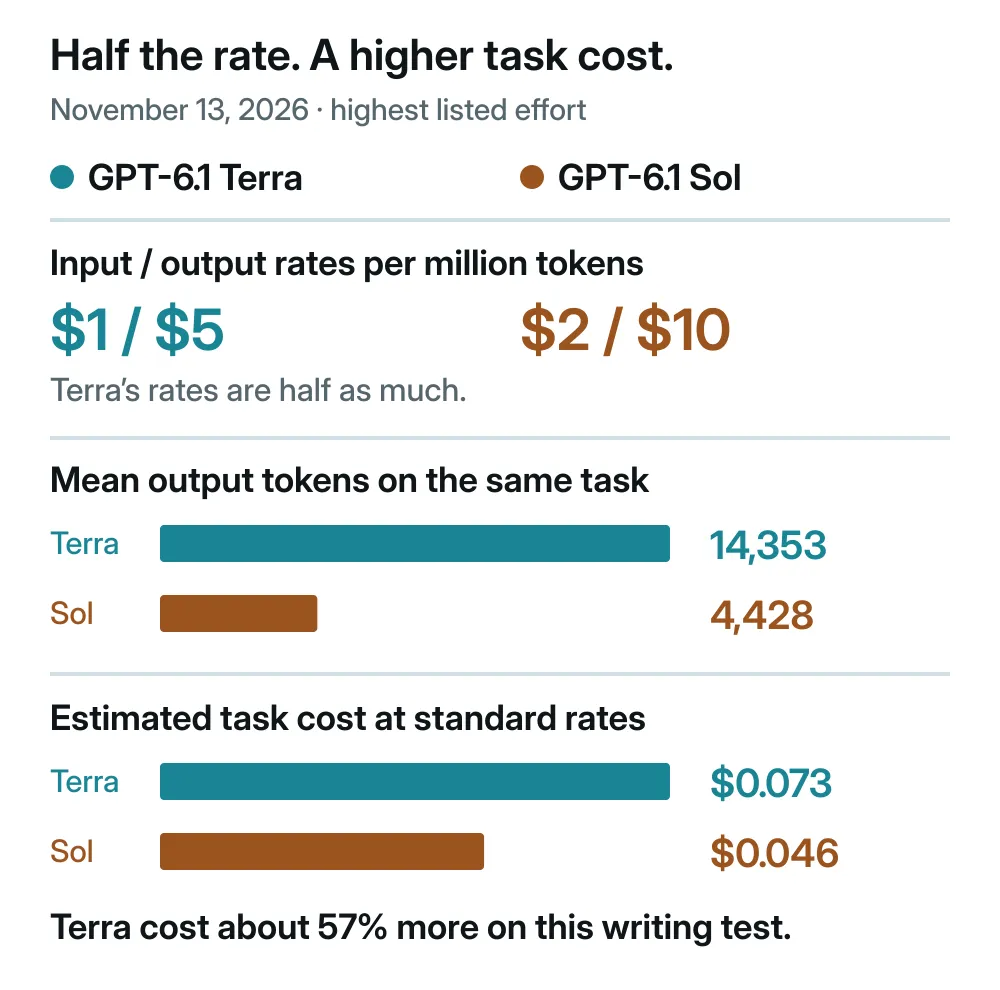
Here is a concrete example from the board on November 13, 2026. At their highest listed effort, GPT-6.1 Terra had input and output rates half those of GPT-6.1 Sol: $1/$5 versus $2/$10 per million tokens. Yet Terra’s mean output-token count was about 14,353, compared with Sol’s 4,428. Their mean input counts were both about 970.
Applying those rates gave estimated task costs of about $0.073 for Terra and $0.046 for Sol. The lower-rate model cost about 57% more on this test. This is a dated illustration, not a permanent verdict on either model.
The live chart shows the wider picture. Each row connects a model’s position by listed token price with its position by measured task cost. A move toward a larger rank number means it became relatively more expensive when we counted the work.
Token-price rank vs. task-cost rank
Compare the price of a fixed token basket with the estimated cost of completing our writing test at highest effort.
○ Token-price rank◆ Task-cost rank#1 = cheapest
Left is cheaper. Green means a better cost rank for the completed task; red means a worse one. These are cost comparisons, not quality ratings.
- GPT-6 Luna1 place worse on costToken-price rank: #1Task-cost rank: #2
- Muse Ember 1.03 places worse on costToken-price rank: #1Task-cost rank: #4
- Claude Haiku 5.57 places worse on costToken-price rank: #1Task-cost rank: #8
- GLM 5.3 Flash1 place better on costToken-price rank: #4Task-cost rank: #3
- GPT-OSS 120B (Fireworks)4 places better on costToken-price rank: #5Task-cost rank: #1
- GPT 5.4 NanoSame cost rankToken-price rank: #6Task-cost rank: #6
- DeepSeek V4.1 Flash 1017Same cost rankToken-price rank: #7Task-cost rank: #7
- Gemini 3.1 Flash-Lite3 places better on costToken-price rank: #8Task-cost rank: #5
- Gemini 3.8 Flash1 place worse on costToken-price rank: #9Task-cost rank: #10
- GPT 5.4 Mini7 places worse on costToken-price rank: #10Task-cost rank: #17
- Muse Spark 1.3Same cost rankToken-price rank: #11Task-cost rank: #11
- GLM 5.31 place worse on costToken-price rank: #12Task-cost rank: #13
- GPT-6.1 Terra3 places worse on costToken-price rank: #13Task-cost rank: #16
- Qwen3.8-2.4T-A95B5 places worse on costToken-price rank: #14Task-cost rank: #19
- Grok 4.77 places worse on costToken-price rank: #14Task-cost rank: #21
- Kimi K3.1 Pro7 places better on costToken-price rank: #16Task-cost rank: #9
- GPT-6.1 Sol2 places better on costToken-price rank: #16Task-cost rank: #14
- Gemini 4 Argon2 places worse on costToken-price rank: #16Task-cost rank: #18
- Claude Sonnet 5.58 places worse on costToken-price rank: #16Task-cost rank: #24
- Gemini 3.1 Pro PreviewSame cost rankToken-price rank: #20Task-cost rank: #20
- GPT 5.3 Codex6 places better on costToken-price rank: #21Task-cost rank: #15
- Kimi K310 places better on costToken-price rank: #22Task-cost rank: #12
- Muse Wonder 1.01 place better on costToken-price rank: #23Task-cost rank: #22
- Claude Opus 5.53 places worse on costToken-price rank: #23Task-cost rank: #26
- GPT-6 Astra2 places better on costToken-price rank: #25Task-cost rank: #23
- Claude Fable 5.1Same cost rankToken-price rank: #25Task-cost rank: #25
Measured on MindsHub. Estimated costs, not quality scores.
How these costs are compared
Token price uses a fixed basket of 1M input + 1M output tokens. Both ranks compare the same 26 models with prices and task data; ties share a rank.
Task costs use our measured tokens at current standard rates, excluding cache discounts, cache writes, tools and special tiers. These are estimates, not bills.
26 models shown; managed aliases and older versions omitted. Refreshes every two hours. Benchmark build: Nov 20, 2026 UTC.
Explore the full cost comparisonThere is no single universal “price per token” because input and output rates differ. For the listed-price ranking, we use the same basket for everyone: one million input tokens plus one million output tokens, without caching. The task-cost ranking uses the writing task’s actual mean token counts at each model’s highest listed effort. Both rankings include only models with both figures available, so they compare the same group.
That basket is a comparison aid, not a prediction of your input/output mix. The task costs are estimates at current standard rates, not customer invoices. The full cost view carries the latest figures and settings.
How much does extra reasoning cost?
Some models offer several reasoning-effort settings. The model name stays the same, but the amount of work it does before answering can change.
A higher setting might help with a difficult analysis. It might also add cost without an improvement you notice. Our writing test measures consumption; it cannot settle that quality question.
The next chart asks a simple question: how much did estimated task cost change when we moved from a model’s lowest reasoning setting to its highest? A value of +100% means the task cost doubled. A negative value means the highest setting cost less on this test.
Lowest to highest effort: cost change
Same writing task. +100% means twice the cost; a negative value means it cost less.
- Claude Opus 5.5+1,860.9%
- Claude Haiku 5.5+1,837.4%
- Claude Sonnet 5.5+1,685.6%
- GPT 5.4 Mini+1,171.6%
- GPT-6.1 Terra+1,112.9%
- Qwen3.8-2.4T-A95B+867.6%
- GLM 5.3+558.9%
- Grok 4.7+554%
- GLM 5.3 Flash+524%
- Claude Fable 5.1+479.9%
- DeepSeek V4.1 Flash 1017+448.7%
- Gemini 3.8 Flash+355.5%
- Gemini 4 Argon+336.3%
- GPT-6 Astra+256.1%
- GPT-6.1 Sol+234.3%
- GPT 5.4 Nano+206.7%
- Gemini 3.1 Flash-Lite+186.5%
- GPT-6 Luna+172.9%
- GPT 5.3 Codex+133%
- Gemini 3.1 Pro Preview+67.8%
Measured on MindsHub. Estimated costs, not quality scores.
How these costs are compared
Change = (highest-setting cost ÷ lowest-setting cost − 1) × 100. Models with one setting, missing endpoint data or a zero starting cost are omitted.
Task costs use our measured tokens at current standard rates, excluding cache discounts, cache writes, tools and special tiers. These are estimates, not bills.
20 models shown; managed aliases and older versions omitted. Refreshes every two hours. Benchmark build: Nov 20, 2026 UTC.
See costs at each reasoning settingThe chart needs different reasoning settings and usable measurements at both ends; models without them are left out. The full cost view shows the individual settings and available measurements.
“High” belongs to each model’s own scale, so it does not mean the same reasoning budget on every model. Paying for extra reasoning makes sense when it improves the result enough to matter to you.
Could Opus at low effort be the better buy?
Claude Opus at low effort and a smaller model at high effort are two candidates you could give the same task. The smaller model may get there cheaply with more reasoning. Opus may need fewer tokens or fewer repairs. Neither outcome follows from the model name or the setting alone.
For a familiar task, the useful comparison is the answer you would keep and the total cost of getting it. The Intelligence view can help you find promising model-and-effort combinations; the Cost per task view shows what those combinations consumed in our writing test. Our cost data does not establish that their answers were equally good.
What this test can tell you
Our test is useful for seeing how models behave on the same request through MindsHub. It does not score the answers for quality, measure a complete agent workflow, or prove that the least expensive response was usable.
For a broader external perspective, Artificial Analysis reports cost per task across its Intelligence Index workload, using measured token consumption and its benchmark weighting. Its scope, prices and cache treatment differ from ours, so the dollar figures answer a different question.
For agentic coding, the HarnessTax study pairs cost with success on its sampled benchmark tasks. It is useful precisely because it records the surrounding harness as part of the result.
These sources add context. They cannot establish whether a summary preserved your key caveat, a plan respected your constraints or a piece of code passed your own tests. Synthetic work makes comparisons repeatable; familiar sample tasks make them relevant.
A cheap answer can still need an expensive rescue
Imagine a team using AI to draft follow-up emails from meeting notes. Model A produces inexpensive drafts, but often misses the action owner. Model B costs more per attempt and usually gets the owner right.
The team isn’t buying attempts. It wants emails people can use. A useful second measure is:
Cost per accepted result = total evaluation spending ÷ accepted results
That total includes rejected attempts and repairs. “Accepted” means the output meets a quality bar chosen for the task, rather than a bar lowered when a bargain appears. If nothing passes, there is no meaningful cost per accepted result.
Human review belongs in the picture too. It can be reported as minutes alongside model spending. Saving a fraction of a cent while adding five minutes of editing is a discount with a peculiar sense of humor.
Waiting matters in the same way. An overnight report can tolerate a pause that would be uncomfortable during a live call. The Performance view separates first-answer wait from writing speed and total response time. A complete workflow may add tool calls, retries and review on top.
What does your own task cost?
In MindsHub Agents, the agent workspace, you can give the same task to two models and see their answers, total time and estimated cost side by side. Compare Models is the navigation item that opens this view.
We tried a fictional repair-café planning task with GPT-6.1 Sol and Claude Sonnet 5.5. The task included a budget, a late volunteer and a tight schedule. Both found important constraints, but their plans allocated the volunteers differently.
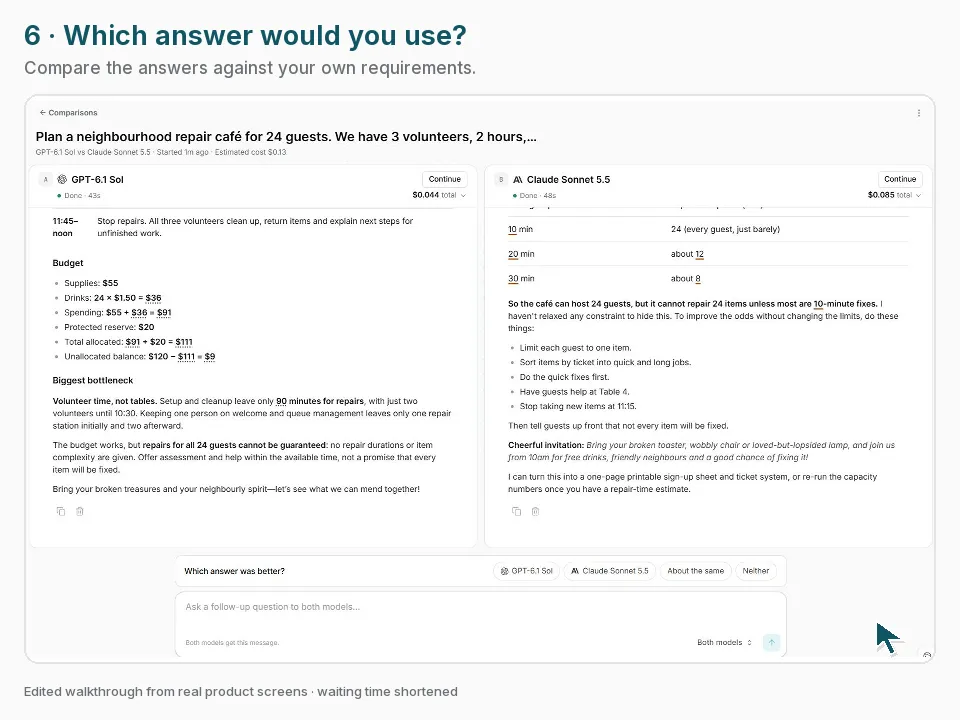
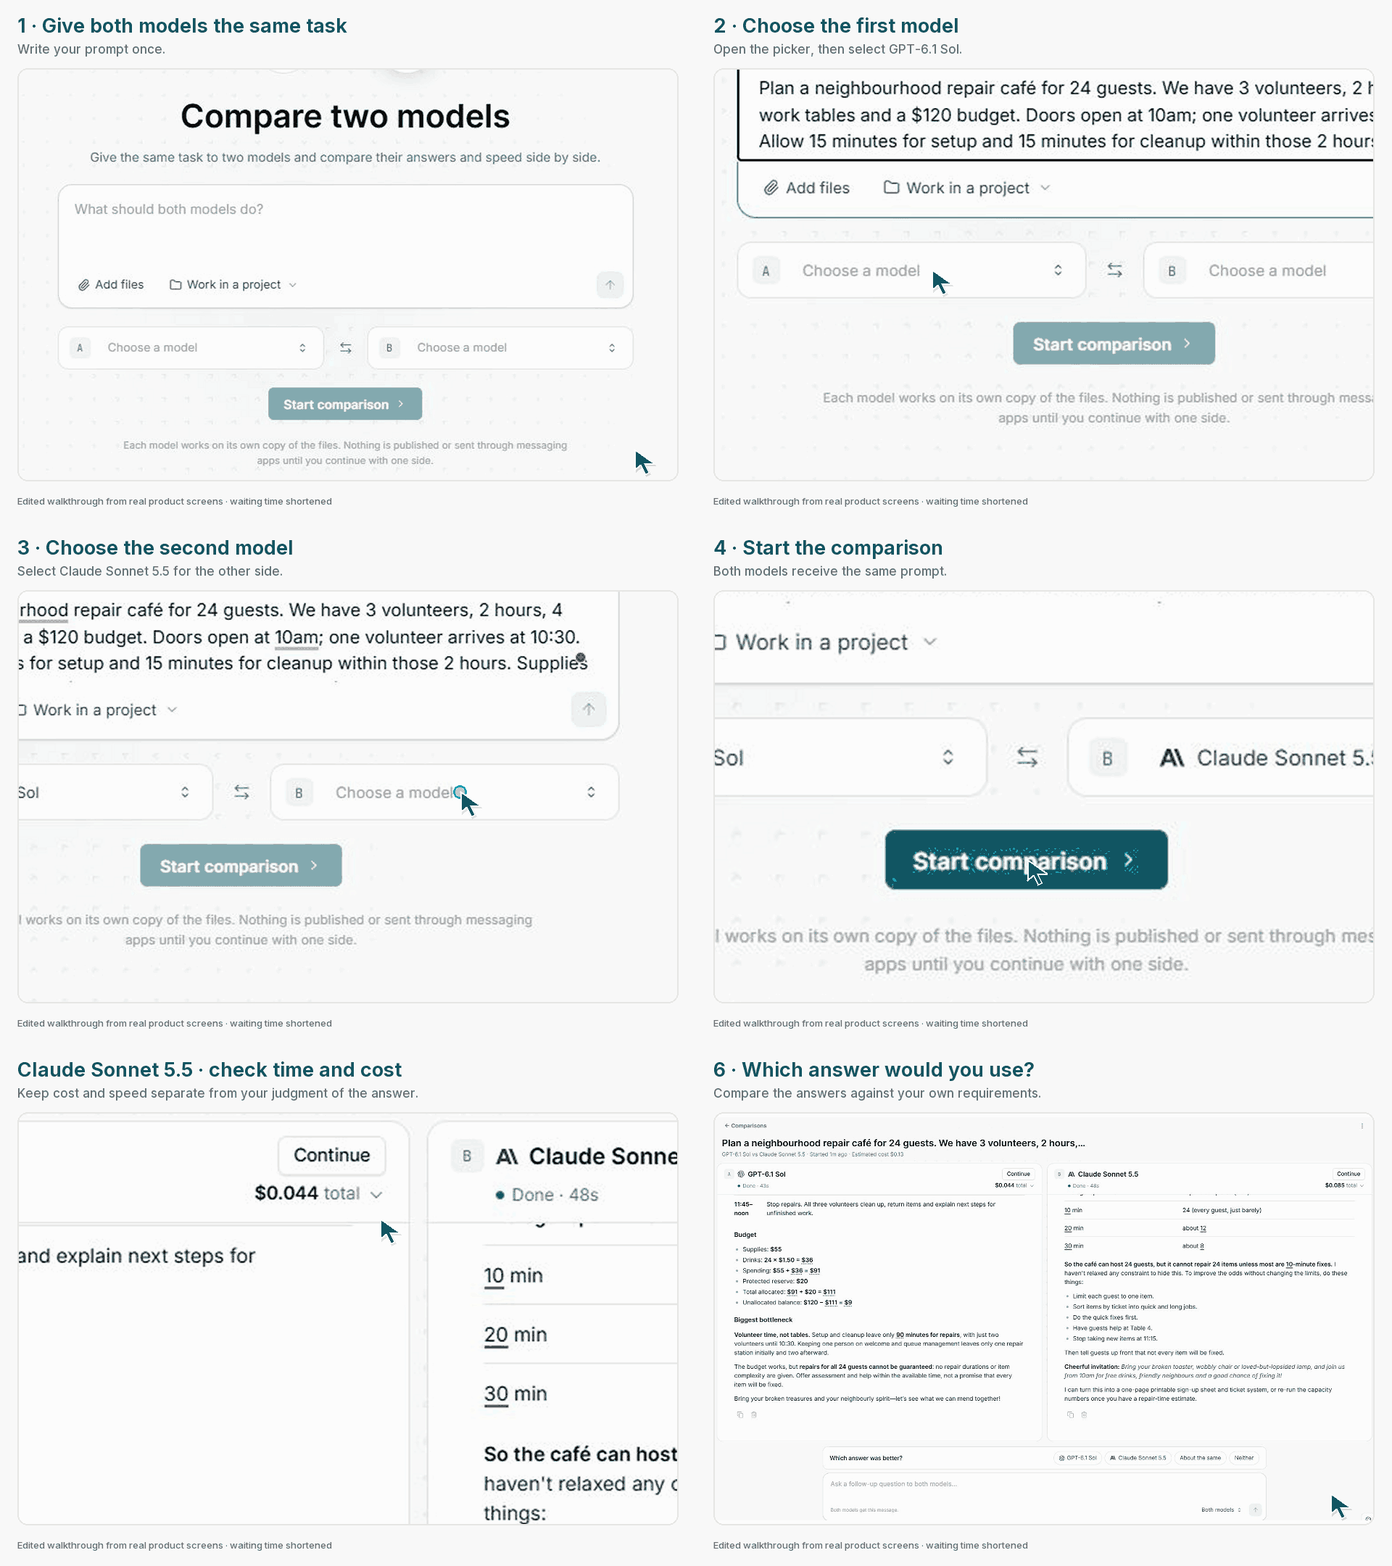
In this one run, GPT-6.1 Sol took 43 seconds at an estimated $0.044; Claude Sonnet 5.5 took 48 seconds at $0.085. These are the interface’s list-price estimates, including the agent’s own calls. They are an example from November 13, 2026, not a promise about future runs.
The numbers become useful alongside the answers. Would you use either plan? Would one need more editing? Was the extra detail worth the difference? A few representative tasks can make those tradeoffs much clearer than a token-price table.
Our side-by-side comparison walkthrough shows the full example and some ideas to try. If you already have a task in mind, you can try it with two models in MindsHub Agents. The live model board is there when you want to explore the wider field.
Frequently asked questions
Is a lower token price always cheaper?
No. A model can charge less per token while consuming more tokens on the same task. Reasoning, answer length, repeated context and retries can change total cost.
How does MindsHub calculate benchmark task cost?
We apply current standard input and output rates to measured mean token counts from a repeated writing task. The estimates exclude cache discounts and do not represent an entire agent workflow or a customer invoice.
Does higher reasoning effort always improve quality?
No quality improvement can be inferred from the cost chart. It shows spending on our test, not answer quality. Whether extra reasoning helps needs to be judged on representative tasks with results you can check.
Why does the harness matter in a model-cost comparison?
The harness manages the model’s context, tools and steps. Changing it can change the number and size of model calls. Holding it consistent makes a comparison between models easier to interpret.
Is benchmark cost the same as cost per successful task?
No. Our writing test measures consumption without grading usefulness. Cost per accepted result includes all evaluation spending, including failures and repairs, divided by the outputs that meet your requirements.